
Rankings vs Real-World Yield: Closing the Gap
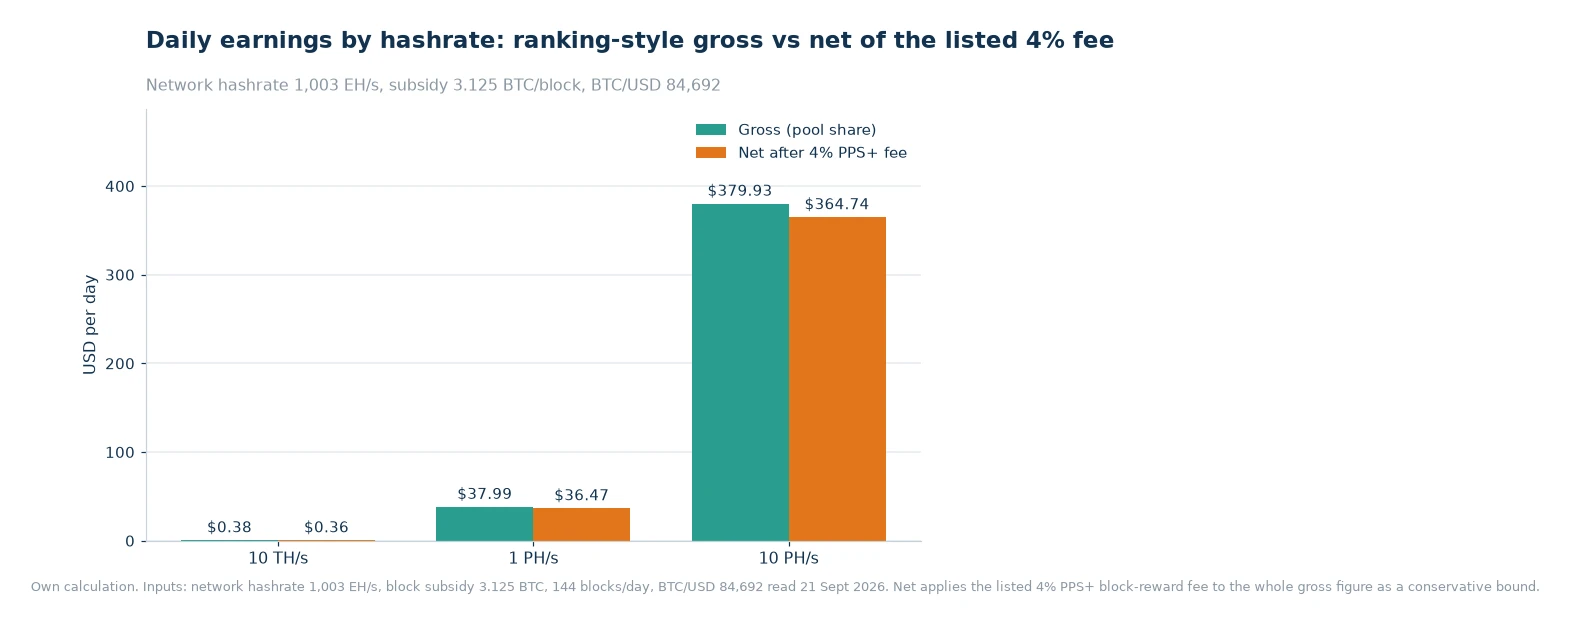
A ranking board says a 10 PH/s farm earns about $379.93 a day at current difficulty and a BTC price of $84,692. What actually reaches the bank account after the listed fee, 200 kW of power at $0.06/kWh and ordinary downtime is closer to $72.90 — about 19% of the figure on the board. Closing that gap is not about finding a better pool; it is about knowing which deductions are structural and which are your own operating choices.
Key takeaways
- Ranking figures are gross revenue at live price and difficulty: 10 TH/s is about $0.38 a day, 1 PH/s about $37.99, 10 PH/s about $379.93.
- At 10 PH/s on 20 J/TH hardware, the listed 4% fee, 200 kW of draw and 5% downtime leave roughly $72.90 a day — about 19% of the headline.
- Efficiency is the deduction you control: the same 10 PH/s at 30 J/TH consumes 300 kW and $432 a day of power against $364.74 of net revenue, which is a loss at $0.06/kWh.
- Hourly settlement at 1 PH/s delivers roughly 0.0000187 BTC — about $1.58 — every hour, which turns a monthly projection into a daily reconciliation.
The core idea
There is no single yield number for mining hardware, because a hashrate figure only fixes one of the two sides of the ledger. The revenue side is arithmetic and shared by everyone: your hashrate divided by network hashrate, multiplied by the 450 BTC the network issues each day, multiplied by one minus the listed pool fee.[1] The cost side is specific to your site, your machines and your operating discipline.
Ranking boards are built to answer the shared half well. They apply one price and one difficulty to a long list of models, which is exactly what you want when you are deciding which hardware class to look at. The mistake is treating the output as net income, because every deduction that follows is larger in aggregate than the fee most operators spend their time comparing.
How it plays out at scale
Small operators feel the gap as a rounding difference; large operators feel it as the whole business. On a 10 TH/s rig, gross revenue is about $0.38 a day and the deductions are cents. On a 10 PH/s farm, the same percentage deductions are measured in hundreds of dollars per day, and each of them moves for a different reason.
Start with the fee, because it is the one deduction the pool sets. The two published payment methods charge on different components: PPS+ settles the block-reward component per share at a listed 4% fee and distributes the transaction-fee component on PPLNS logic at a listed 2%, while PPLNS applies a single listed 2% fee to block rewards and transaction fees together. Reading PPS+ as a flat 6% on everything overstates the cost, and the published breakdown explains why the two rates exist at all — one is charged where the pool absorbs luck and orphan risk, the other where it does not.[2]
Then come the deductions nobody publishes for you: energy, uptime, cooling, network and replacement parts. Those are the difference between two operators running the same hardware on the same pool, and they are where the phrase "real-world yield" comes from.
Two scenarios compared
Both scenarios use a 10 PH/s farm at current difficulty and a $84,692 BTC price, so revenue is 0.004486 BTC a day, or $379.93 gross. The only difference is the machine class.
| Line | Amount per day | What it represents |
|---|---|---|
| Gross revenue | $379.93 | 10 PH/s at current difficulty and BTC price |
| Less listed 4% fee | −$15.20 | Listed fee applied here across the whole figure, a conservative bound on the PPS-settled block-reward component |
| Net revenue | $364.74 | What the pool settles to the account |
| Less electricity | −$288.00 | 200 kW = 4,800 kWh per day at $0.06/kWh |
| Margin before downtime | $76.74 | Operating margin at full uptime |
| Less 5% downtime | −$3.84 | Revenue falls 5% while a portion of power is still drawn |
| Operating margin | $72.90 | About 19% of the gross figure on the board |
Now change one input. The same 10 PH/s on 30 J/TH hardware draws 300 kW, or 7,200 kWh a day, which is $432 of electricity against $364.74 of net revenue. At $0.06/kWh that configuration loses $67.26 a day before downtime is even considered. Nothing about the ranking changed, because ranking boards do not know what your machines draw.
The small end of the ladder behaves the same way, just with fewer zeroes. A 10 TH/s rig produces about $0.38 gross a day and roughly $0.07 of margin after power on 20 J/TH at $0.06/kWh; a 1 PH/s farm produces about $37.99 gross and about $7.67 of margin over $28.80 of power. The margin ratio stays in the same neighbourhood because the efficiency assumption is identical — which is the useful lesson: the ratio is a property of your power economics, not of your size.[3]
Settlement cadence is what lets you see any of this early. Paid hourly at current difficulty, a 1 PH/s setup returns about 0.0000187 BTC an hour, roughly $1.58, and a 10 PH/s setup settles in proportion. A daily reconciliation against expected output catches a failing worker, a tariff change or a stale machine class within days instead of at month end.
Common failure modes
- Treating the board as net. Every figure on a ranking page is revenue at a single price and difficulty. Power alone can consume three quarters of it.
- Assuming 100% uptime. Firmware updates, network faults, thermal events and firmware reboots are real. Even 5% downtime costs $3.84 a day at 10 PH/s in this example.
- Using rated hashrate instead of effective hashrate. A machine running 6% below its rating loses 6% of revenue while its power draw stays flat, which hits margin harder than revenue.
- Ignoring the difficulty trend. Difficulty was 132.76 T on 21 September 2026, with an estimated −2.12% adjustment next; the same line moved upward for most of the network's history.
- Comparing headline fees only. The listed 4% and listed 2% attach to different components of a payout, so the same headline number can mean two different things across two payment methods.
Two habits close most of the gap. First, model your own site rather than the network average: put your tariff, assumed uptime and machine efficiency into a calculator and compare the result with what the ranking board shows. Second, reconcile what settled against what should have settled, weekly — the ViaBTC Miner Ranking gives you the model-level figure to check against, and the mining pool overview explains which payment method produced the balance you are looking at.[4]
Frequently asked questions
Does the payout method change my average income?
It changes the variance and the fee, not the underlying expected value: your share of network hashrate still sets the ceiling.
How often should a miner check pool statistics?
Weekly is enough for cash flow, daily if you are reconciling worker uptime or chasing a hashrate fault.
Write your own yield figure
Use the board to choose a hardware class, then replace every default with a number from your own site: the tariff on your invoice, the efficiency measured at the wall, and the uptime your logs actually show. Run the resulting margin once a week against what settled in the account, and treat any gap bigger than a couple of percent as a fault to investigate rather than a rounding error. That single habit converts a ranking figure into an operating number you can make decisions with.
Data and sources: ViaBTC pricing and fee documentation[1][2], the profit calculator[3], the miner ranking board[4] and on-chain difficulty data. Network hashrate (1,003 EH/s), difficulty (132.76 T), the 3.125 BTC block subsidy and the BTC price of $84,692 were read on 21 September 2026. Yields are illustrative, assume $0.06/kWh electricity and 20 J/TH unless stated, and change with difficulty, price and tariff.